How to Actually Read Your Spending Reports
A category breakdown and a day-of-week chart are only useful if you know what to look for. Here's how to read your own spending analytics and act on them.
Once you’ve tracked expenses for even a few weeks, you’ll have a report in front of you — a category breakdown, maybe a chart of spending by day of the week. Having the data is only half the job. Most people glance at it, feel vaguely informed, and move on without actually using it. Here’s how to read it properly.
Start with the category breakdown, but don’t stop at the biggest number
The most obvious thing a spending report shows is which category ate the most money. It’s tempting to just look at the top line and stop there — but the more useful question isn’t “what’s my biggest category,” it’s “is this category big because it’s supposed to be, or because it crept up on me?”
Rent, for instance, is supposed to be your biggest category most months — that’s not a red flag, that’s just how a budget is structured. Food delivery being your second-biggest category, ahead of transportation, might be exactly what you expected — or it might be a genuine surprise once you see the actual rupee figure next to the category name instead of a vague sense of “I order in sometimes.”
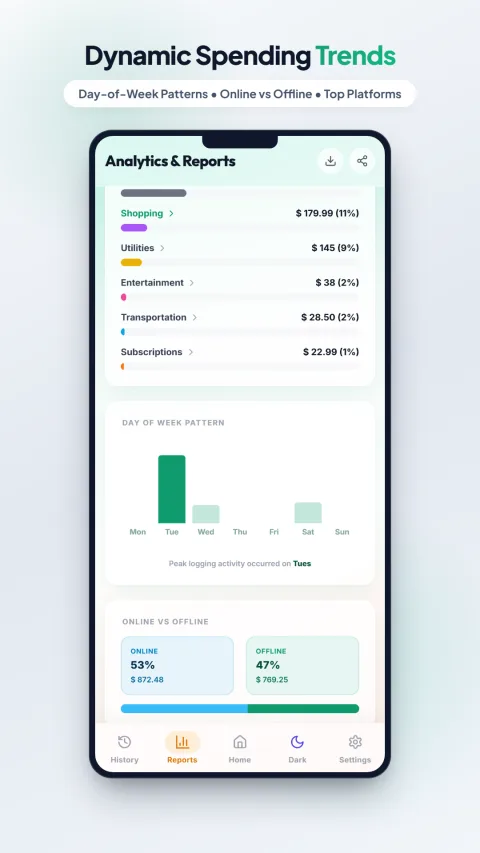
A category breakdown report — the percentage next to each category matters more than the raw amount, since it tells you where your money is proportionally going.
A practical way to read it: for each category, ask “would I have guessed this number, roughly, before seeing it?” The categories where your guess was way off are the ones worth paying attention to — not because they’re wrong, but because they’re the ones you’re not consciously tracking in your head.
Month-over-month comparison tells you about trends, not just totals
A single month’s report is a snapshot. The genuinely useful signal comes from comparing this month to last month, or to a running average. A category that’s growing every month, even slowly, is a trend — and trends compound the same way SIP returns do, just in the wrong direction if left unchecked.
If your reports show something like “+226% vs previous period” on total spending, that’s not automatically bad — it might be a one-off (a family trip, a large planned purchase). The follow-up question is whether that jump is a one-time event or the start of a new, higher baseline. Only a few months of consistent tracking can actually answer that.
Day-of-week and online-vs-offline patterns reveal when you’re vulnerable
Beyond categories, patterns in when you spend are often more actionable than what you spend on. If your spending spikes heavily on a specific day (say, right after payday, or every Friday night), that’s a specific, addressable moment — much easier to plan around than a vague resolution to “spend less.”
Similarly, an online-vs-offline split matters because online spending tends to have less friction — a saved card and one tap complete a purchase, compared to physically handing over cash. If your online share is unexpectedly high, that’s often less about what you’re buying and more about how easy it’s become to buy it without thinking.
A day-of-week pattern chart and an online vs. offline split — both point to *when* and *how* you spend, not just *what* on.
Drilling down: from category to individual transactions
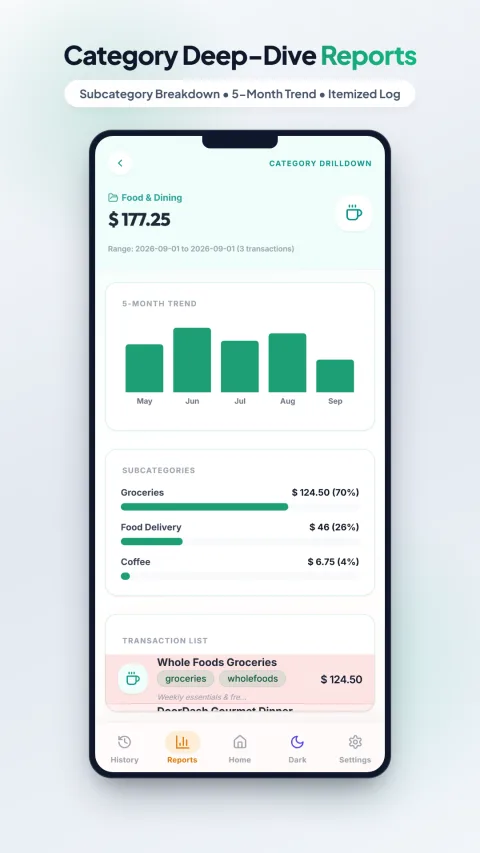
A category total is a summary, not the full story. If “Food & Dining” looks larger than expected, the useful next step is drilling into the subcategories underneath it — groceries vs. food delivery vs. coffee, for instance — since those three behave completely differently even though they share a parent category. Groceries are usually a necessity that scales with household size; food delivery is far more discretionary and far more responsive to a genuine effort to cut back.
Drilling into a category's subcategories and its 5-month trend turns a single number into an actual pattern you can act on.
Turning insight into action
Reading the report is step one; the actual point is using it. Once you know your real monthly surplus after seeing a few months of honest data, that number — not a guess — is what should feed into a SIP Calculator to see what consistently investing it could grow into. The report tells you what’s true about your spending. What you do with that truth is the part that actually builds wealth.
This kind of category, trend, and drilldown reporting is what My Expenses Tracker is built to surface automatically from your logged expenses — entirely from data that stays on your device.
Full disclosure
See these exact reports for your own spending — try My Expenses Tracker
Free, 100% private, fully offline. Your data never leaves your phone.
Learn more from official sources
- Reserve Bank of India — Financial Literacy — general household budgeting guidance.
This is general information, not personalised financial advice. My Expenses Tracker is a free app built by the same person behind this website — disclosed here for transparency, not as a sponsored placement.